Student numbers 2016/17
The make-up of our student body, plus numbers of applicants and acceptances.
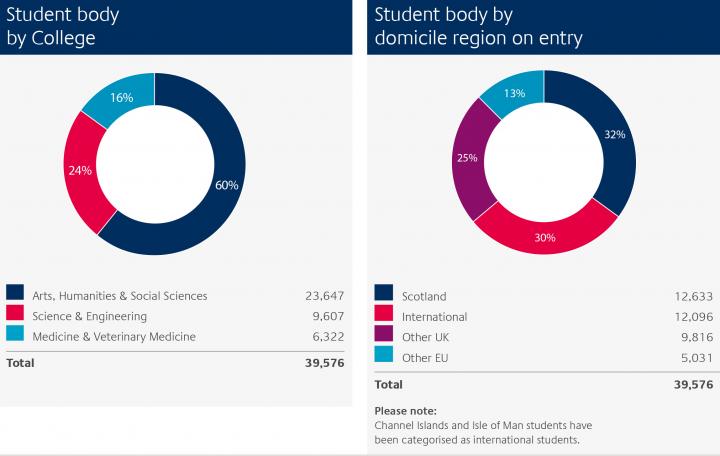
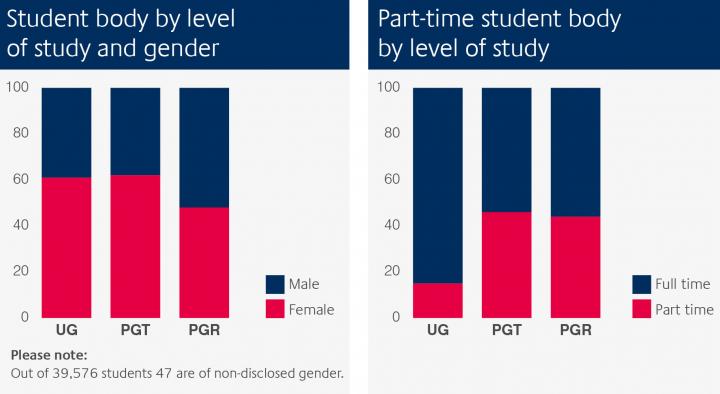
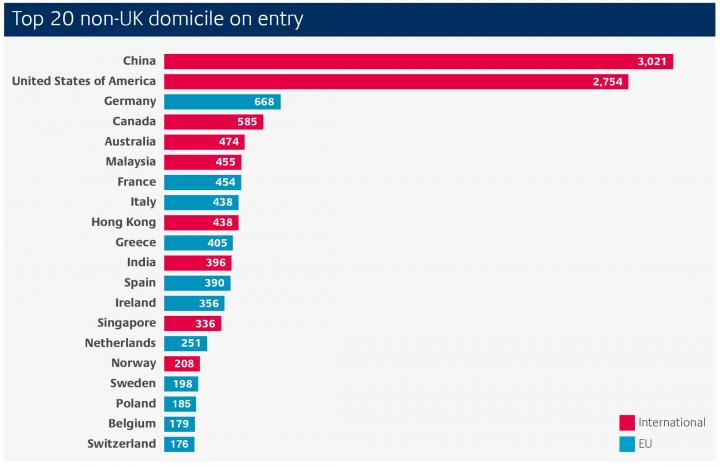
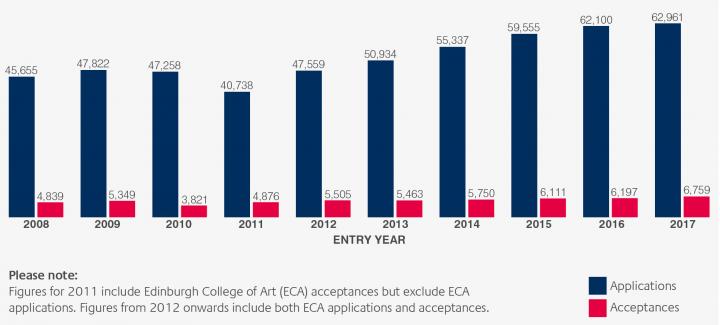
This page shows how our student body is comprised, and how the numbers of undergraduate applications and acceptances have varied over the past decade.
UG: undergraduate
PGT: postgraduate taught
PGR: postgraduate research
Level of study by College
| UG | PGT | PGR | Total | |
|---|---|---|---|---|
| Arts, Humanities & Social Sciences |
15,910 |
5,598 |
2,115 |
23,647 |
| Science & Engineering |
6,286 |
1,256 |
2,065 |
9,607 |
| Medicine & Veterinary Medicine |
3,033 |
2,111 |
1,178 |
6,322 |
|
25,229 |
8,965 |
5,358 | 39,576 |


The figures above represent all students matriculated during the session, with the exception of those exiting or interrupting their studies within five weeks of the first semester start date. Visiting students, part-time and distance learning students, and students on collaborative programmes are included. Domicile on entry is declared by the student when first matriculating onto their programme.
Undergraduate applications and acceptances
| 2008** | Men | Women | Total | |
| Applications* | 21,193 | 24,462 | 45,655 | |
| Acceptances | 2,221 | 2,618 | 4,839 | |
| 2009 | Men | Women | Total | |
| Applications* | 22,523 | 25,299 | 47,822 | |
| Acceptances | 2,479 | 2,870 | 5,349 | |
| 2010 | Men | Women | Total | |
| Applications* | 21,601 | 25,657 | 47,258 | |
| Acceptances | 1,631 | 2,190 | 3,821 | |
| 2011 | Men | Women | Total | |
| Applications* | 18,549 | 22,189 | 40,738 | |
| Acceptances | 1,981 | 2,895 | 4,876 | |
| 2012 | Men | Women | Total | |
| Applications* | 20,371 | 27,188 | 47,559 | |
| Acceptances | 2,281 | 3,224 | 5,505 | |
| 2013 | Men | Women | Total | |
| Applications* | 21,707 | 29,227 | 50,934 | |
| Acceptances | 2,286 | 3,177 | 5,463 | |
| 2014 | Men | Women | Total | |
| Applications* | 22,984 | 32,353 | 55,337 | |
| Acceptances | 2,365 | 3,385 | 5,750 | |
| 2015 | Men | Women | Total | |
| Applications* | 24,563 | 34,898 | 59,555 | |
| Acceptances | 2,395 | 3,714 | 6,111 | |
| 2016 | Men | Women | Total | |
| Applications* | 25,345 | 36,755 | 62,100 | |
| Acceptances | 2,452 | 3,745 | 6,197 | |
| 2017 | Non-disclosed gender | Men | Women | Total |
| Applications* | 8 | 25,735 | 37,218 | 62,961 |
| Acceptances | <5 | 2,594 | 4,161 | 6,759 |
Please note:
*Number of applications received in each cycle for entry in the same year or deferred entry the following year.
**UCAS reduced the number of applications per applicant from six to five from the 2008 entry cycle.


